Trading indicators are tools that help you analyze the market, predict price fluctuations and other events. They can be used for both short-term and long-term trading strategies. Trading indicators come in many forms, but they all have one thing in common: they’re based on historical data that helps traders make predictions about future trends.
Contrary to how some people feel about crypto trading and analysis, there are plenty of good indicators that can help you understand what’s happening with the market right now and what’s likely to happen next. The best crypto trading and analysis tools can be broken down into two categories: those that look at the overall market and those that examine specific coins or trading pairs including LUNC USDT and ALBT USDT.
What is a trading indicator in crypto?
Trading indicators are used to help traders make more informed decisions. They can be used to predict future price movements or measure the strength of a trend.
Indicators are not perfect and should be used in conjunction with other tools, such as candlestick patterns, support and resistance levels, or chart patterns.
Leading indicators
Leading indicators are important to crypto traders because they indicate future price movements. Leading indicators can be used to predict a cryptocurrency’s price movement, so it’s essential for any trader to know what they are and how they work.
Leading indicators commonly include:
- The number of users in the network (i.e., user activity)
- Volume traded on an exchange (i.e., trading volume)
Lagging indicators
A lagging indicator is a price action confirmation tool that helps traders to determine the strength of the current trend. Unlike leading indicators, lagging indicators are not used to predict future price movements but rather confirm what has already happened.
Lagging indicators are a type of technical analysis that are used after the fact to help you determine your entry and exit points in crypto. The idea is that you want to buy low and sell high, so it’s important to be able to tell when the price has recently bottomed out or peaked.
It’s a good idea to check the charts from time to time to make sure you’re not getting caught up in a bubble or riding a dead cat bounce without knowing it. The trick is looking for indicators that aren’t actually moving themselves; they just show you changes in other things’ values that have already happened.
What are the different types of trading indicators to be aware of?
You should be aware of the different types of indicators and what they’re used for. Indicators can help traders make decisions about their trades but they’re not magic bullets.
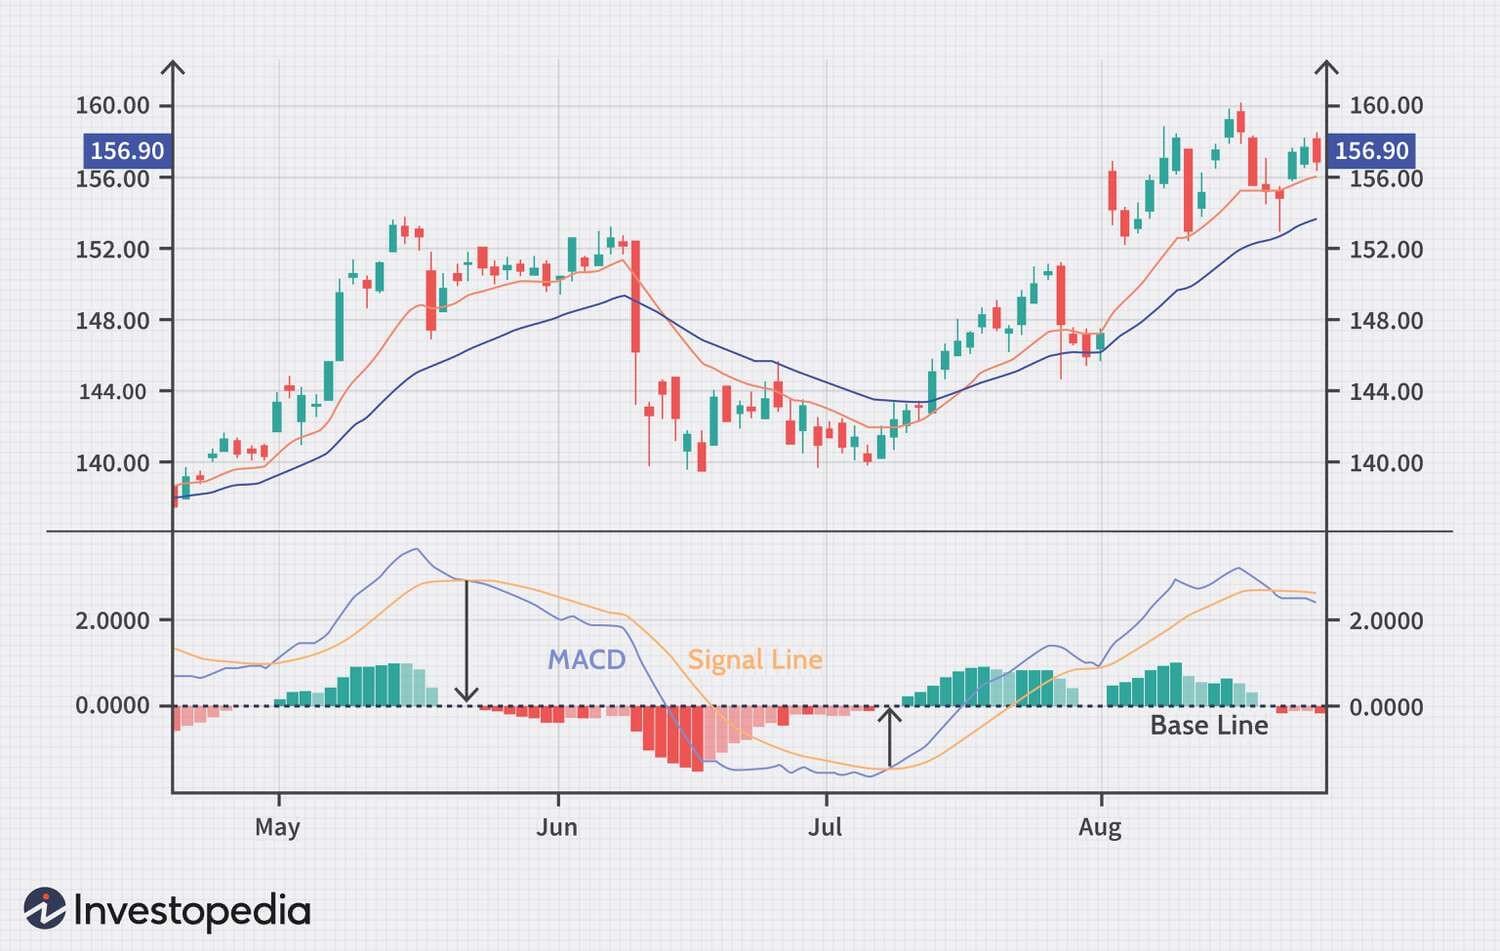
Moving Average Convergence Divergence
Moving Average Convergence Divergence (MACD) is a trend-following momentum indicator that shows the relationship between two moving averages of prices. The MACD line is a signal line that is calculated by subtracting the 26-day exponential moving average (EMA) from the 12-day EMA.
The histogram shows the difference between these two lines, i.e., whether they are converging or diverging over time. When both lines converge, it indicates bullishness. When they diverge it indicates bearishness. When one line crosses above or below another line, this is known as crossovers and can be used for trading signals in crypto markets by traders who understand how everything works together.
Relative Strength Index
Relative Strength Index (RSI) is a momentum indicator that compares the magnitude of recent gains and losses over a specified period of time. It oscillates between 0 and 100 with signals generated by divergences, changes in trend direction, loss-of-momentum moves and overbought/oversold conditions.
RSI is one of the most popular tools used by technical traders to measure whether an asset has been overbought or oversold at any given point in time. When RSI moves above 70 it indicates an overbought market while when it drops below 30 it points out that there’s an oversold market condition prevailing at present.
There are many traders who use these levels as support or resistance levels during their trading strategies because once they are broken they tend to act like magnets attracting new buyers (or sellers) into those markets again which can lead them back up towards their previous highs/lows again if you’re lucky enough.
Bollinger Bands
Bollinger bands are a technical indicator that consist of a center line and two outer bands. The upper band is a simple moving average of the high minus the low, while the lower band is a simple moving average of the low minus the high.
Bollinger Bands can be used to identify extreme price action, as well as support and resistance levels. If you see prices trading within these bands then you should expect some type of movement soon after due to how volatile this area is known to be for traders looking to buy or sell assets at any time during market hours (9am-5pm EST).
OBV (On Balance Volume)
OBV is a momentum indicator that measures the cumulative flow of money into and out of a security. The OBV is a simple line chart that shows volume on the vertical axis and price action on the horizontal axis.
The basic premise behind this indicator is that rising prices result from an increase in buying activity, while falling prices are caused by an increase in selling activity. The OBV attempts to quantify these trends by measuring changes in market depth over time; when there’s more buying than selling (and vice versa), it means investors are feeling optimistic about their investments so they’re willing to pay more for them–and vice versa for sellers who want to cash out before things get worse.
Conclusion
The best trading indicators for crypto are the ones that help you make better decisions. They can be used to confirm your own analysis, or even as a standalone tool to make trades. The most important thing is to find indicators that work well for you and your trading style so that they become second nature when making decisions on whether or not to buy or sell cryptocurrency assets.
Image Courtesy: www.investopedia.com